Problem. Project‑level road measurement needs spatially faithful data for year‑over‑year comparison—group delay must not shift features.
Approach. Built AXON1 with SELCOM SLS5000 laser, µg‑resolution accelerometer to cancel vehicle motion, wheel‑pulse odometry >1 pulse/mm; linear‑phase IIR so bumps appear where they are. Computed IRI, RMS bands, MPD, longitudinal profile at 5–10 cm.
Result. Passed Vägverket qualification; repeatable across speeds; operators could point to the exact physical location of defects.
TDMA Power Saver Late 1990s
Successive power ramp‑down/up with Kaiser windowing to idle time‑slots—prevented spectral splatter while saving energy. Implemented on embedded integer DSP.
Problem. Base‑stations burned power on idle TDMA slots; naïve on/off produced spectral splatter.
Approach. Kaiser‑windowed ramps smoothed power edges; fixed‑point DSP implementation met tight timing.
Result. Clean spectrum, real energy savings; shipped despite initial skepticism.
Double Complementary Lattice Wave Filters 1990s
Zero-phase filtering holds truth in place — whether it’s a bump in asphalt or the depth in a Double Gauss lens.
Implementations of double‑complementary lattice‑wave IIR filters for measurement systems and filterbanks; phase‑linear / zero‑phase behavior with robust real‑time performance.
Problem. Real‑time splice assessment with dual cameras and an operator view that normalizes perspective.
Approach. One C40 DMA per camera for concurrent line capture; DMA auto‑init sequenced lines to display; mapping equalised near/far fibre thickness with minimal CPU.
Result. Stable UI, low latency; CPU freed for analysis.
Philips Fileserver Rescue 1990s
Diagnosed linker segment size limits causing runtime swaps to fail in a multi‑segment executable. Refactored module layout and link map to fit toolchain constraints.
Problem. Weeks of instability from code‑segment swapping obscured the root cause.
Approach. Treated it as a linker limit: one module exceeded max per‑segment size; enforced smaller modules and adjusted link map.
Result. Stable server within days; extended engagement delivered.
Software Build Throughput 1990s
Demonstrated much faster builds by reducing hyper‑modularity (too many tiny object files) and relieving compiler/linker I/O bottlenecks on legacy toolchains.
Problem. Hyper‑modular codebase + legacy toolchain created excessive I/O and link‑time overhead—builds crawled.
Approach. Consolidated micro‑modules where appropriate, tuned compiler/linker flags, and re‑arranged build graph to reduce intermediate I/O.
Result. Orders‑of‑magnitude faster builds; happier developers; no hardware spend.
Automated Antenna Test System
July–September 2004
Perl-based automated test platform on a low-cost PC with a serial interface.
Ran concurrent tests across multiple antennas and, crucially, preserved memory
of all previously detected firmware errors to prevent regressions. Initially
doubted internally; later vindicated when a major telecom operator in Spain
reported the same flaw the tool had already flagged.
Problem. No automated QA for embedded firmware/hardware; testing was manual and slow.
Approach. Built a command-line test rig in Perl. Each routine launched as its own process so multiple antennas
could be exercised in parallel over a single PC. Every discovered defect was codified into the suite, creating a
living regression archive.
Result. Recurrent issues were caught automatically. Months later, a Spanish operator confirmed the exact defect
the suite had flagged. Lightweight automation that not only tests, but remembers.
Full legacy write-ups, preserved exactly from the original site.
Profilometers with zero-phase filtering are excellent because they provide high resolution and accuracy in measuring surface topography and roughness.
The zero-phase filtering can remove any effects of low-frequency noise or vibrations that may interfere with the measurement,
resulting in more precise and reliable results.
This makes them very useful in various fields such as manufacturing, automotive, and aerospace engineering, where surface quality is important.
Stockholm, Sweden.
We ceased our measurement operations, and for good reason. You see, the esteemed Swedish Road Administration, known as Vägverket, requested a proposal for the measurement of over 20 objects, and were provided with an excellent price for that quantity.
However, when the time came to execute the project, they had only booked 14 measurements, leading to a flawed calculation for the originally intended 20 objects. It seems they believed themselves to be clever in securing a lower price per object, but in reality, they were being sly and deceitful. As a result, I chose to discontinue my services for those sneaky devils.
Axon1 is a cutting-edge, one-track road surface profilometer that revolutionizes the way road irregularities are measured. This innovative device utilizes a state-of-the-art combination of laser, accelerometer, and distance sensors to deliver unmatched precision and accuracy in measuring road profiles of short lengths, ranging from 10-50 kilometers.
Designed with ease of use and portability in mind, Axon1 boasts a total weight of under ten kilos (20 lb.), making it easily transportable to and from the measurement car. Its rapid deployment profilometer is also ideal for use in airfields, as I experienced while measuring an airstrip at Arlanda, Stockholm.
What sets Axon1 apart from its competitors is its unique approach to measurement. Unlike other profilometers that use optical triggers to start the measurement, Axon1 employs a fixed point located 500 meters from the object start and measures the number of wheelpulses from that point to the object start. This method ensures that the measurement starts accurately and promptly, saving both time and money.
During development, an old record player was repurposed to simulate road cracks and generate input data for the laser. The laser was expertly mounted to measure the height differences generated by the notches rotating under it. This simple yet effective approach made it easy to change the input signal for the laser by swapping out records on the record player.
Calibrating the system was a breeze, with the laser being calibrated by a known in height metallic cube, and the accelerometer calibration being done by moving the car up and down while measuring the up and down movement with the freshly calibrated laser. The calibration value is then calculated by correlating the laser measurements with the accelerometer to negate the car's up and down acceleration. The entire calibration process only takes a minute, making it highly efficient and easy to use.
Axon1 is the perfect choice for road measurement, even in the toughest of environments. The device is enclosed in a sturdy box, making it easy to handle in dirty and wet conditions. Overall, Axon1 is an excellent choice for anyone seeking the ultimate in road surface profilometry, delivering unmatched accuracy, efficiency, and convenience.
Thanks to the fast and innovative development of DSP technology, combined with the precision of state-of-the-art lasers and accelerometers, Oberon has achieved a groundbreaking system that accurately measures longitudinal road surface properties at normal traffic speeds. The AXON1 measurement system, developed by Oberon, meets the highest quality requirements and incorporates as few self-developed parts as possible, utilizing already-proven high-quality components available in the market, resulting in a cost-effective development process without compromising quality.
Oberon's hardware and software components are seamlessly integrated to create a sophisticated measurement system that can quickly respond to customer needs. The development process involved some effort, particularly for the analogue parts, but the end result is a product that exceeded expectations and proved to be a perfect fit for road "object" measurement requirements.
For project level road measurement, accuracy and quality are of paramount importance. It is essential to compare the road data with future measurements of the same project, which is why repeatability and equipment stability are critical for providing consistent results over a number of years. The transducers' resolution must be extremely precise, and the software algorithms must be executed with floating-point accuracy to avoid any distortion of the measurement data.
On the other hand, road network measurements provide a statistical view of the measured road network and identify the location of bad road parts, while the project level road measurement focuses on determining a specific object's deterioration over time. Project level data is analyzed at the smallest level, ensuring the highest level of scrutiny, whereas road network measurements offer an overall view of a country's road conditions.
In summary, Oberon's AXON1 system, developed using cutting-edge technology and top-quality components, offers an unparalleled solution for longitudinal road surface measurements. Its accuracy, repeatability, and stability make it ideal for project level road measurement and analysis, providing the necessary data to ensure high-quality and safe road networks.
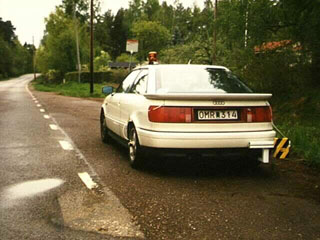
Measurement car circa year 2000. AXON1 was expertly installed onto a lowered AUDI vehicle with firmer suspension in a matter of minutes, showcasing its remarkable efficiency. Unlike traditional sensor boxes that require special equipment to be mechanically mounted onto the tow ball, AXON1 was ingeniously secured onto the car's rear transport mount, further highlighting its advanced design.
The Swedish National Road Administration, SNRA, has recognized AXON1's exceptional capabilities in measuring object measurements, as demonstrated through a rigorous project-level survey. At the time of its qualification in December 1997, AXON1 was one of only two companies approved for this task.
AXON1 underwent an extensive evaluation by the prestigious VTI, Road and Transport Research Institute, where it repeatedly measured fifteen different road strips at various speeds over a two-week period in May 1996, totaling over 150 measurements. The results of this evaluation were presented in a comprehensive report, dividing the qualification into two parts, measuring road networks and road objects, with the latter being a novel concept at the time.
The ability to measure road objects, or a stretch of road that could be newly constructed, allowed for an accurate assessment of its compliance with SNRA's quality requirements. AXON1's exceptional high-accuracy equipment facilitated the measurement of IRI for one of the three critical road properties for object measurements: crossfall, IRI, and rutdepth, while other road properties were optional.
For those interested in learning more about the intricacies of IRI and longitudinal profile, a detailed description is readily available on the University of Michigan's website. Overall, AXON1's impressive performance and versatility have established it as a leader in the field of road measurement technology.
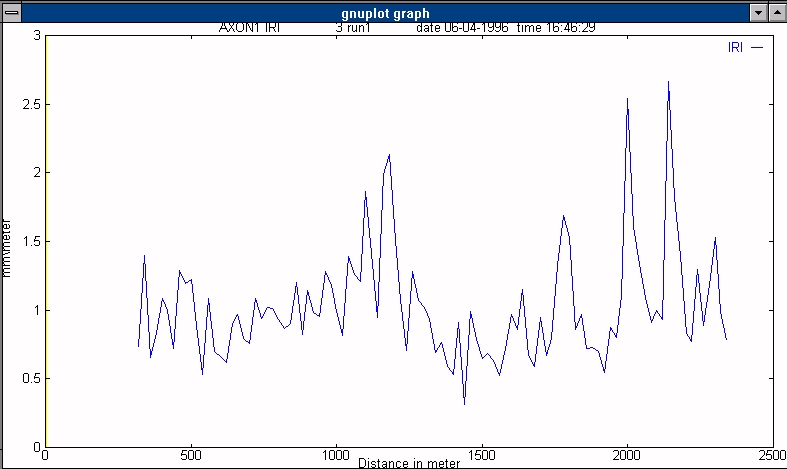
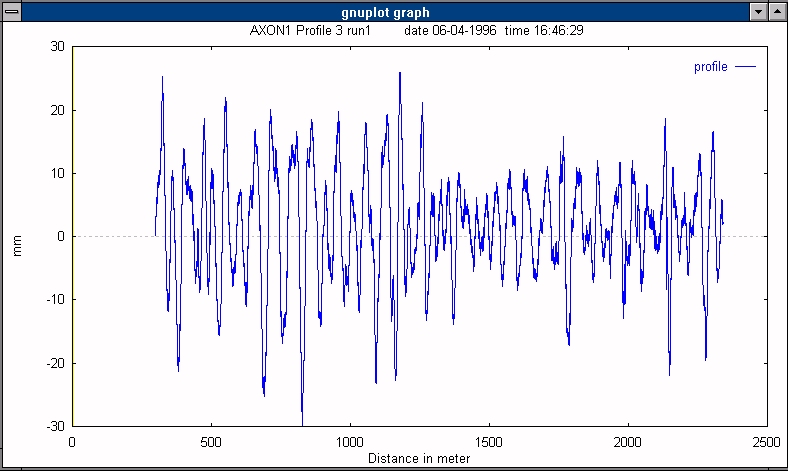
AXON1 is an exceptional measurement tool that boasts a range of advanced features to ensure that road conditions are accurately assessed. With its precise and efficient measurement capabilities, AXON1 is capable of measuring and saving longitudinal profile data at intervals of just five or ten centimeters, as well as calculating twenty meters RMS values for the profile across different wavelength bands. In addition, AXON1 can calculate the international road unevenness value IRI, providing an accurate measure of the road's condition over a distance of twenty meters. The road profile is filtered in a novel way giving a phase linear filtering. Thus, when using the road profile data the irregularity is shown in the data at the exact spot where it is on the road. The measurement shows a true profil which is not distorted by the measurement. This positive fact is very unusual.
Furthermore, AXON1 is equipped with the ability to compute the new texture value (MPD) according to the ISO standard, ensuring that road conditions are measured to the highest standards of accuracy. The device is able to identify irregularities with long wavelengths in the road's longitudinal profile, indicating potential issues with soil movement beneath the surface.
AXON1's measurement variables are comprehensive, including the IRI, RMS (with four values for four different wavelengths), Textur (MPD), longitudinal profile (at 5 cm or 10 cm intervals), and distance (in millimeters). The main measurement device, the SELCOM SLS5000 laser, is incredibly precise, with a resolution of 50 micrometers. In addition, the device is equipped with a top-of-the-line accelerometer with 1 micro g resolution, which eliminates any up and down movement caused by the car to ensure that the measurement data is as accurate as possible.
AXON1 also utilizes a wheel pulse transducer, which boasts a resolution of better than 1 pulse per millimeter, providing an incredibly precise measure of the road's condition. The data collected by AXON1 is saved and post-processed, and thanks to the device's powerful floating point digital signal processors, the data can be plotted live on a display, providing real-time insights into the road's condition.
Overall, AXON1 is a cutting-edge measurement tool that is highly accurate, reliable, and capable of providing comprehensive insights into the condition of roads. With its advanced features and precise measurement capabilities, AXON1 is an excellent choice for anyone seeking to measure and assess road conditions with the highest level of accuracy.
Measurement of IRI.
Measurement of profile.
Adventure number two
Exploring the Elegance of Double Complementary Lattice Wave Filters in Measurement Applications
I am pleased to offer for sale my expertly crafted implementations of double complementary lattice wave filters. Once you get the hang of these filters, I guarantee that you'll never want to use anything else.
Finding high-quality Lattice Wave C-code implementations can be a real challenge, which is why I've decided to make my implementations available for purchase.
My C-code is the real deal - it's designed to actually do the job, not just provide vague, abstract descriptions. I pride myself on working with nitty-gritty details, and you'll have the opportunity to purchase and use them for yourself.
In addition, I've also provided abstract-level documents to complement the C-code. However, my code offers a unique low-level perspective that allows you to really engage and "play" with the concepts. Don't miss out on this opportunity to elevate your work with top-of-the-line implementations of double complementary lattice wave filters.
You are undoubtedly a clever individual who is more than capable of completing this task on your own, but consider the time you could save with a little help.
Incredible resources await you with this c-code filter package: automatic generation of filter coefficients, implementation of the filter, an FFT algorithm written in c-code, generation of magnitudes, and a method for achieving phase linearity.
If you're interested in learning about FFTs, I highly recommend the original papers authored by Cooley and Tukey from 1965. I purchased them during an IEEE book sale some years ago, and I can attest to the value they provide.
This c-code implementation is a treasure trove of knowledge. Over the course of eight years, I've worked with these filters in countless configurations - some deemed impossible - such as multirate filtering, filterbanks, decimation, interpolation, and many more. Through it all, this implementation has never let me down.
Even with all of its valuable information, I still keep some secrets close to my chest. However, this C code implementation alone represents the kind of material for which others receive doctorate degrees.
The lattice wave double complementary filter is an exceptional filter with a unique and impressive double complementary property. Simultaneously acting as a highpass and lowpass filter, the filter's output is truly magnificent. By adding together the two signals, the complete magnitude is restored, resulting in unparalleled efficiency and effectiveness, making it an excellent choice for filterbanks, multirate applications, and beyond.
One of the most notable features of this filter is that the power in the signal remains unchanged, even when it is divided into different partitions. This quality is truly remarkable and sets the filter apart from others in its class. The lattice wave double complementary filter is also incredibly stable, making it possible to modify the filter coefficients in real-time without any unexpected behavior, which is especially useful for adaptive filtering processes.
The filter's stability is so reliable that it never "explodes," which is an outstanding achievement that underscores its unparalleled performance. With the lattice wave double complementary filter, you get the speed of an IIR filter and the stability of an FIR filter. It's hard to find another filter that can match its exceptional qualities, making it a top choice for many applications.
If you're interested in exploring the fascinating world of lattice waves, a quick internet search will yield a wealth of information. One particularly noteworthy source is Gazsi's seminal paper, "Explicit formulas for lattice wave digital filters," which was published in IEEE Transactions on Circuits and Systems in 1985. I highly recommend getting your hands on a copy of this article - it's a true beauty!
As someone who has implemented lattice wave filters on floating-point DSPs,
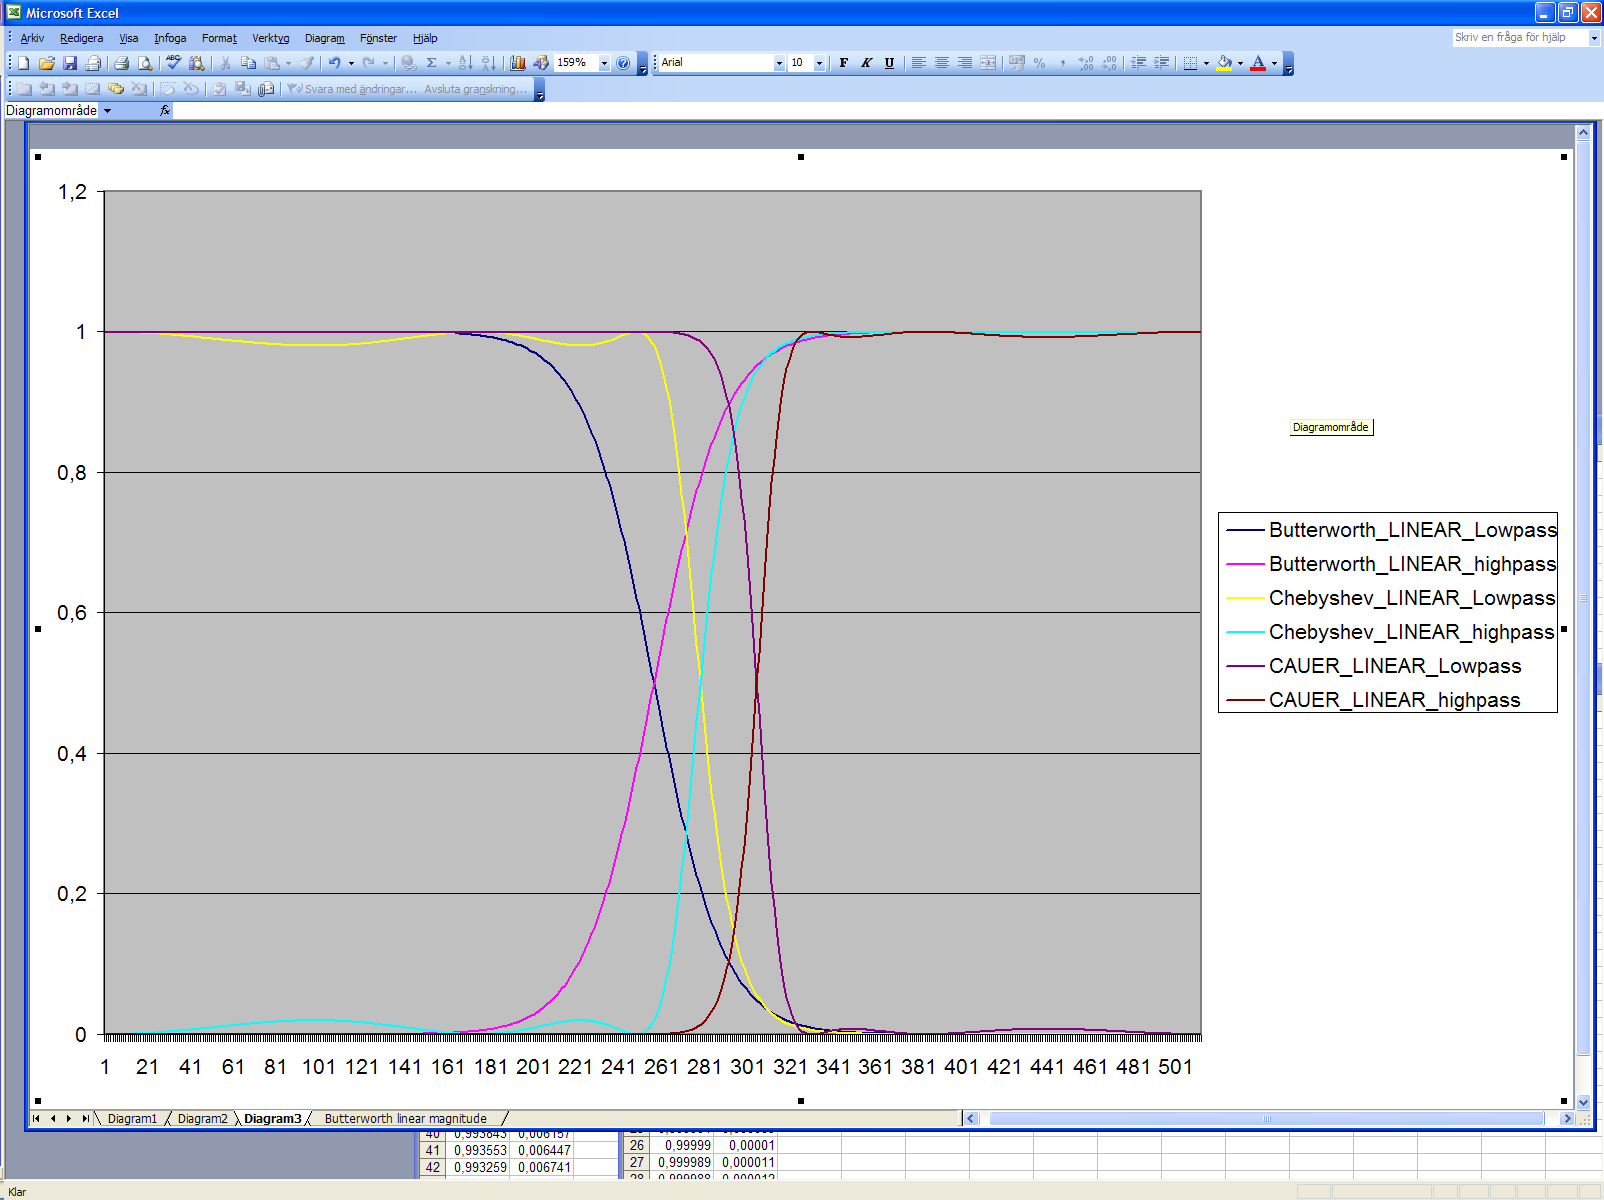
I've taken it upon myself to simplify the filter implementation algorithms even further. The C code that you'll receive is ANSI-C and should compile easily on any system. It generates filter coefficients for three different types of filters - Butterworth, Chebyshev, and Cauer - and can be easily customized based on your desired sampling rate, cutoff frequency, and filter order. Note that the filter order is always an odd number, such as 1, 3, 5, 7, etc.
In addition to the three aforementioned filters, you'll also receive a method that I've personally developed for producing linear-phase filtered data. This is especially useful for measurement or telephone systems that require high-quality, artifact-free data. If you're really interested, I have an even better method that I'm happy to discuss with you further for an additional cost.
The code is highly efficient and can process continuous input data in a matter of milliseconds. It filters an impulse response for each of the three filter types and generates text files that can be easily imported into Excel. The code also includes FFT and magnitude calculation capabilities, allowing you to visualize the filter magnitude for each of the six filtered impulse responses. The FFT method that I use is the Brigham method, which leverages a 512-point complex FFT for 1024 points of real values, resulting in even faster processing speeds.
Although the code may take a bit of time to execute due to the file-writing and formatting requirements of Excel, the output is well worth the wait. You'll receive text files containing six non-linear filtered impulse responses, six linear filtered impulse responses, six magnitudes from FFT of non-linear filtered impulse responses, and six magnitudes from FFT of linear filtered impulse responses. This comprehensive set of data allows you to examine the filter magnitude for each of the three filter types in both lowpass and highpass configurations. As someone who has implemented lattice wave filters on floating-point DSPs,
I've taken it upon myself to simplify the filter implementation algorithms even further. The C code that you'll receive is ANSI-C and should compile easily on any system. It generates filter coefficients for three different types of filters - Butterworth, Chebyshev, and Cauer - and can be easily customized based on your desired sampling rate, cutoff frequency, and filter order. Note that the filter order is always an odd number, such as 1, 3, 5, 7, etc.
In addition to the three aforementioned filters, you'll also receive a method that I've personally developed for producing linear-phase filtered data. This is especially useful for measurement or telephone systems that require high-quality, artifact-free data. If you're really interested, I have an even better method that I'm happy to discuss with you further for an additional cost.
The code is highly efficient and can process continuous input data in a matter of milliseconds. It filters an impulse response for each of the three filter types and generates text files that can be easily imported into Excel. The code also includes FFT and magnitude calculation capabilities, allowing you to visualize the filter magnitude for each of the six filtered impulse responses. The FFT method that I use is the Brigham method, which leverages a 512-point complex FFT for 1024 points of real values, resulting in even faster processing speeds.
Although the code may take a bit of time to execute due to the file-writing and formatting requirements of Excel, the output is well worth the wait. You'll receive text files containing six non-linear filtered impulse responses, six linear filtered impulse responses, six magnitudes from FFT of non-linear filtered impulse responses, and six magnitudes from FFT of linear filtered impulse responses. This comprehensive set of data allows you to examine the filter magnitude for each of the three filter types in both lowpass and highpass configurations.
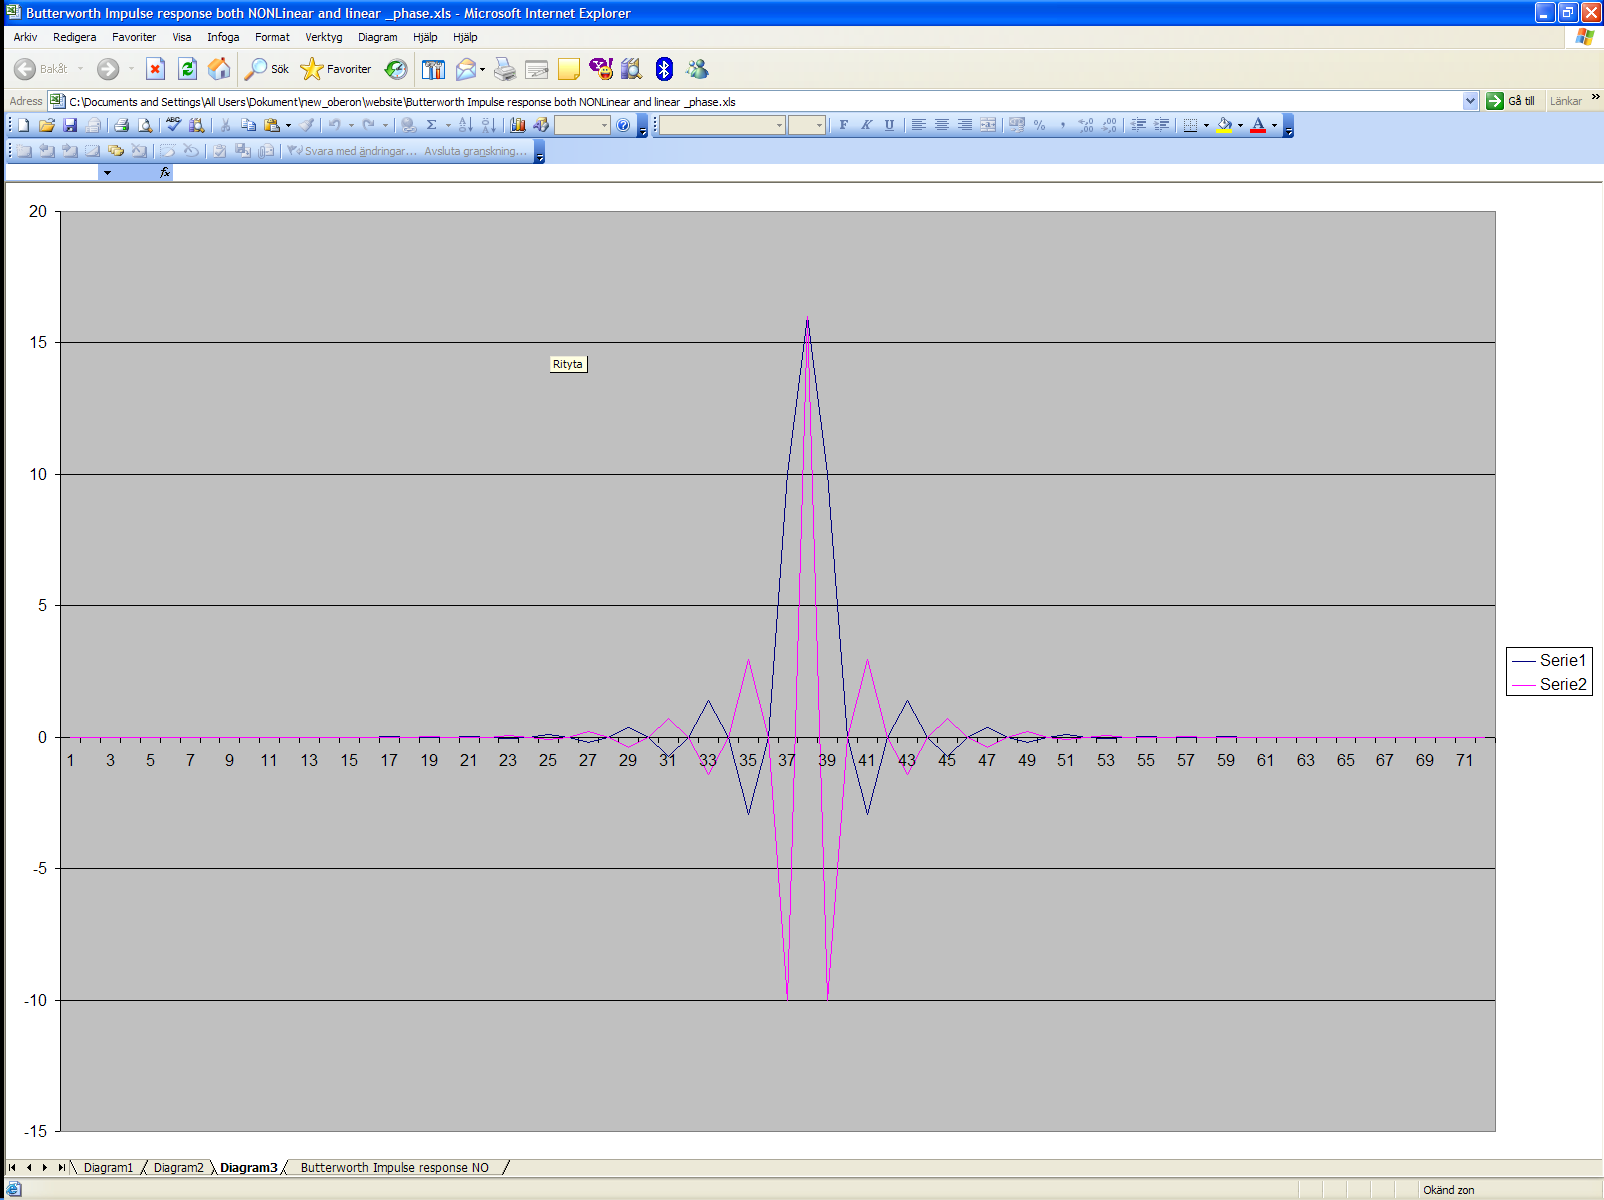
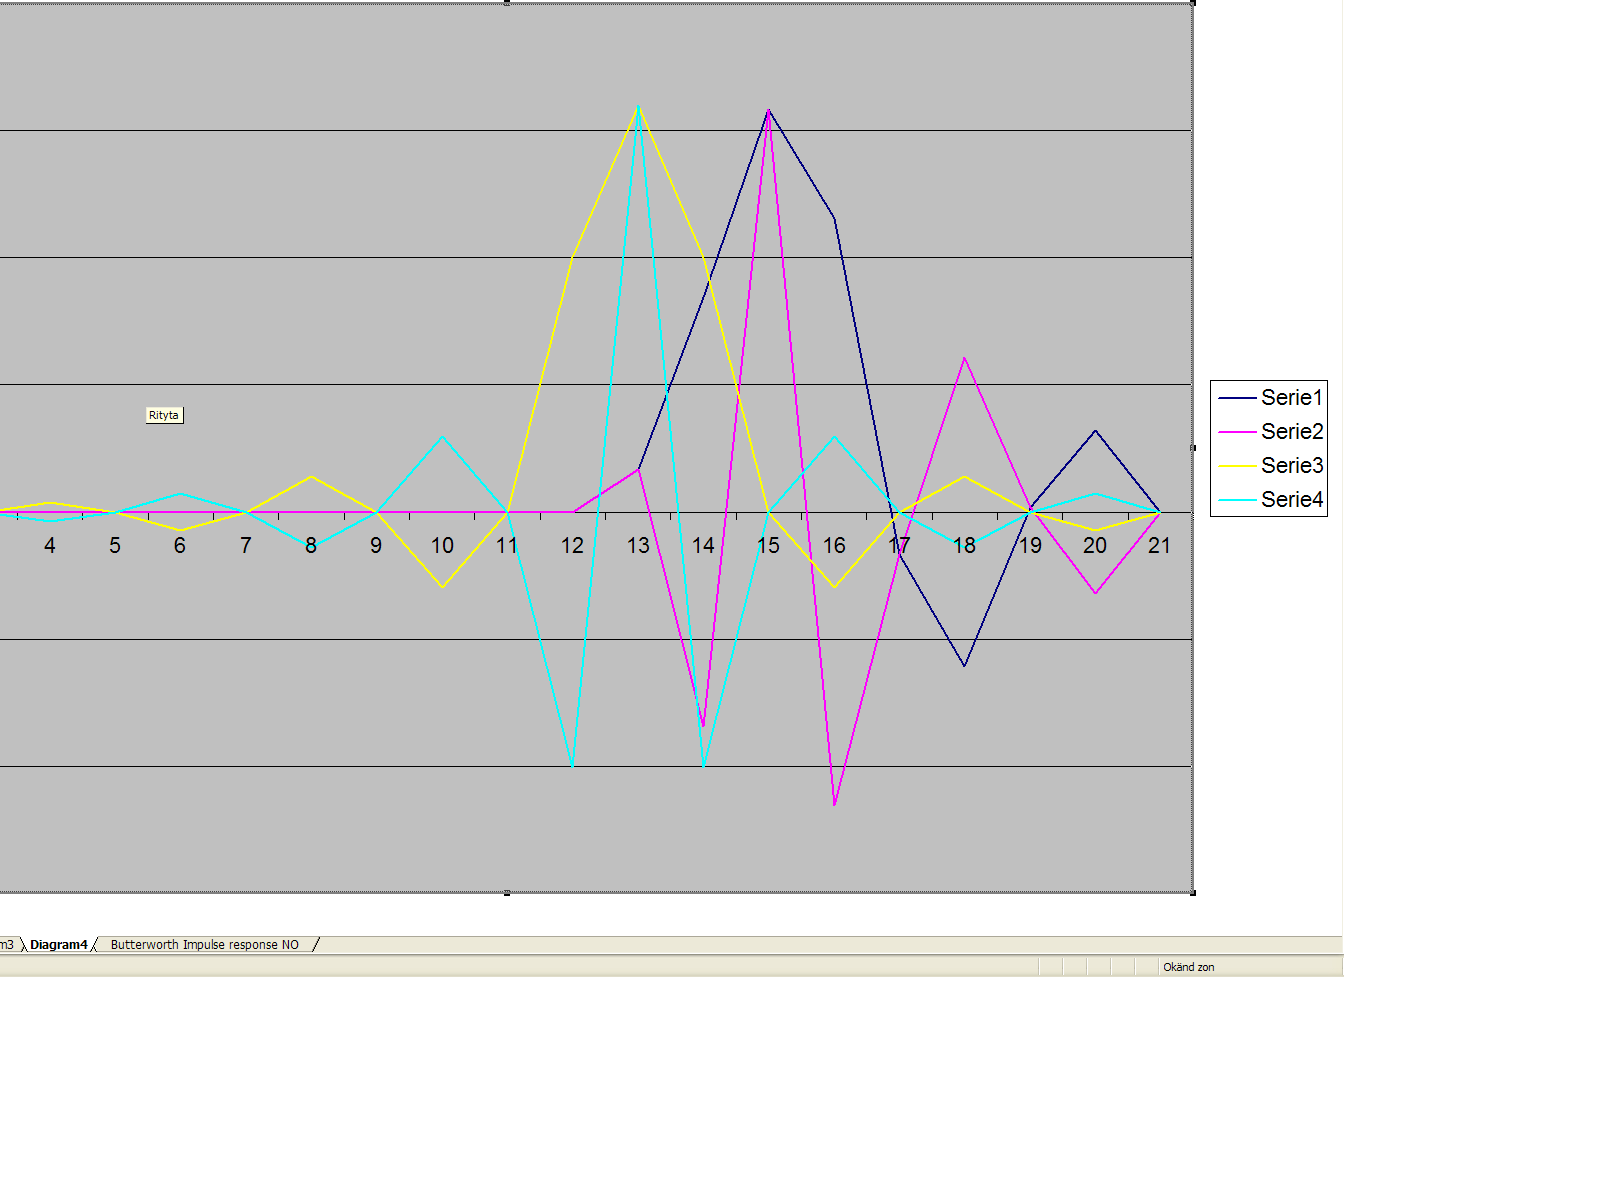
The LINEAR PHASE impulse response of both low and highpass filtered impulse that is later inserted into the FFT.
Excel file
In this image, you'll find two sets of impulse responses - one for a Butterworth linear phase filter and the other for a non-linear phase filter. The difference between these two is stark and immediately apparent. The linear phase filter produces a symmetrical impulse response, whereas the non-linear filter introduces tilting, as evidenced by the higher pink point at point 14 compared to point 16. This is due to the unstationary part of the difference equation that defines the filter, which is not present in the linear phase filter as it only operates in the stationary part of the equation.
Understanding the difference between these two types of filters is vital when building measurement systems because the response of the filter implementation can differ significantly from the system being measured. As someone who has built road measurement systems and measured bumps in the road decimeter by decimeter, I learned this lesson the hard way. It was much easier to explain to road builders when the measured bump was in the exact physical location, as would be the case with a phase-linear or zero-phase filter, rather than being shifted by two meters due to non-linear phase errors in the filter.
An impulse response must look the same in the output data as it does in the filter, without being distorted by phase shifts. For example, even a small stone with spiky edges in the asphalt should be seen as an impulse in the filter and should appear the same in the output data, without any phase distortion. This is why understanding the difference between linear and non-linear phase filters is so important, especially when building measurement systems.
Impulse responses of a Butterworth Linear phase, and a NON linear phase.
Magnificent job!
Thank you sincerely for staying with me thus far and delving into the intricacies of the C code module.
I poured my heart and soul into its implementation, streamlining it to be as compact and practical as conceivable.
So, without further ado, I implore you to revel in its beauty and relish the process!
I am excited to share how I innovatively changed the fiber optic splicer for the largest Telecom company in Sweden. One of the challenges in the splicing process is calculating how well the splice is in regard to attenuation of a faulty splice. To address this challenge, two cameras are mounted at a 45-degree angle to take a video and photos of the splicing process, which are used to execute a mathematical calculation for each splice.
Initially, the plan was to use a powerful floating point for real-time image processing of the input, and the choice of DSP was TMS320C40. As someone who had worked with Texas DSPs for several years, I got involved in making software for a Texas TMS320C40 floating point signal processor (DSP).
One of my first tasks was to find an excellent real-time system for the TMS320C40 DSP. Another task was to process, in real-time, incoming video from two cameras, which were looking at the same object at a 45-degree angle. My innovation was to elegantly use DMA (Direct Memory Access) to get the video data into memory line by line from the camera. I used one DMA coprocessor to concurrently get images from each camera line by line in memory. The DMA is easily reprogrammable as it was done for parallel processing.
The optical perspective from incoming camera should be changed. Both videos should display the ribbon in a similar way, regardless of the camera angle. I implemented a plan to process the image in memory and created an image to be displayed to the operator. I calculated the average number of lines that contains a splice from the 12 fibers and adjusted the closest and farthest fibers' lines to create fibers in the ribbon with a similar size. The C40 had programmable DMA, which auto-initialized without CPU intervention, and selected which lines that are going to be sent to the display and in which sequence.
The result of my innovation was that the CPU did not have to do any real-time image processing for the display. With the use of DMA, the video data was efficiently stored in memory, and the display wishes data for a number of lines sequentially sent. This reduced CPU load and increased the efficiency of the splicing process.
In conclusion, with my innovative use of DMA to elegantly store the video data in memory, the splicing process became more efficient and reduced the need for real-time image processing by the CPU.
I am so thrilled to share with you, so I repeat in another way, also, the innovative change I made to the implementation of the Texas Instruments TMS320C40 for parallel processing. With the TMS320C40, there were six communications ports and six-channel direct memory access (DMA) coprocessors, and I saw an opportunity to use the DMA coprocessor for video memory usage instead of relying on CPU load.
I knew that it was essential for the hardware people to select one communication port per camera, and I used one DMA coprocessor to get the video data into memory line by line from the camera. By doing so, I was able to concurrently store images from each camera in memory, line by line, making the DMA easily reprogrammable for parallel processing. The display required data for a number of lines sequentially sent, and the DMA's programmable capabilities allowed me to select which lines to send automatically without any CPU intervention.
My implementation plan was to process the image in memory and create an image to display. I realized that the displayed image did not need to be exact as the image had already provided the data for good or bad splicing in memory. To calculate the average number of lines containing a splice from the 12 fibers, I subtracted five selected lines from the closest fiber to be 15 and duplicated selected lines from the farthest away to also be 15 lines. This resulted in the creation of one table that was constant throughout the splicing process, requiring only one calculation.
With this innovation, the CPU did not perform any real-time image processing for the display, resulting in an elegantly streamlined process that relied heavily on the DMA coprocessor for video memory usage. The TMS320C40's capabilities combined with my innovative change resulted in a more efficient and effective solution for parallel processing.
That was easy.
I am incredibly proud of the innovative and elegant solution I implemented for the largest telecom company in Stockholm to save power in TDMA standard base-stations. My task was to develop a solution that would power down time slots for idle slots, those with no active telephone call, in order to conserve energy.
At the time, power was continuously on for all slots, regardless of whether or not there was an active telephone connection. The challenge was to turn off and turn on power in a time slot without generating a "square" signal in output power, which would have disrupted antennas and other equipment.
Leveraging my several years of experience with digital signal processing, I implemented a successive power down and successive power up approach, while applying a Kaiser window on the time slot. This not only effectively conserved energy, but also eliminated any energy spikes, ensuring a seamless power transition.
The implementation process was not without its challenges, as embedded integer DSPs can be quite complex. However, after one to two months of dedicated work, I successfully developed and implemented the solution.
When I presented my solution to my project leader, he was astonished and admitted that he had been told it was impossible. However, I was not deterred, and my persistence and expertise led to the successful implementation and eventual use of my solution in TDMA base-stations in the USA, specifically using Texas Instruments DSP.
In summary, I am thrilled to have been able to use my knowledge and experience to develop an innovative and elegant solution that solved a complex problem in the telecommunications industry. It was a challenging but immensely rewarding experience, and I am grateful for the opportunity to have made a meaningful impact on the industry.
What can I say ?
During my time at Philips in Stockholm, I had the incredible opportunity to work on implementing C in a 16-bit environment. This involved crafting a C-library of functions and application interfaces, linking them with the real-time operating system, and compiling them using a C-compiler. I also worked on a file server at Philips Telecommunicatie in The Hague, Netherlands that allowed multiple connected systems to share a massive disk.
The file server's "exe" file was too large to fit in the program memory in full, so we had to segment it into several runtime code-segments that were swapped in and out of memory as needed. The executable modules in the fileserver were linked by the linker software, and my team and I faced some significant challenges with the server that had persisted for weeks. With my expertise and persistence, I was sent to The Hague to tackle the problem head-on.
I arrived on a Wednesday evening and was shown the progress they had made on the problem. I spent the next day collecting information and analyzing the error's occurrence and behavior. During the night, an idea struck me that it had to be a memory problem, although my colleagues had examined the application meticulously and found nothing. On Friday, I uncovered the root cause of the problem - an executable module needed more memory than what the linker could handle. I quickly made changes to the linking process and software components to ensure that all code modules were smaller than the linker's maximum allowed memory for a code module.
The fileserver was up and running, and I had solved a problem that had been plaguing my colleagues for weeks. I was able to head back home to Sweden that same Friday, only to be met by an angry Philips boss who thought I had abandoned my responsibilities. But when I informed him that I had already solved the problem, his disbelief turned to amazement.
As a result of my success, I was offered a long-term assignment with Philips Telecommunicatie in The Hague, where I collaborated with a team to develop software. My experience at Philips was a defining moment in my career, and I am grateful for the opportunities and challenges that I encountered during my time there.
In a large telecom company in Sweden, I had the opportunity to work with Texas Instruments DSPs and write software code for them. While working on this project, I noticed that the company wrote C code modularly in files containing very little code. Each file contained only one function, and it was treated as a separate module. Every module after compiling generated an object file. The object modules were later used by a linker for generating a load module. However, I soon realized that this approach was inefficient and time-consuming.
Despite having a lot of people using expensive SUN workstations for compiling and developing software, the company's modular programming approach was taking an unnecessarily long time. After some investigation, I discovered that having too many small modules was creating a problem. The big company had around 2000 software modules (files), each including two include files and generating one object file each. This meant that there were 8000 opening, writing, saving of files, and it became extremely time-consuming, especially as hard disks were very slow at that time. Moreover, the linker had to read the 2000 object modules, which was much slower than reading only a few object modules.
This is when I had my "AHA" moment. By having a lot of code in one file, I could make the time for generating a load module 100-1000 times faster. The compiler would read the software file in one read, which would be much more efficient than time-consuming file openings/writing/closings. Compiling and generating only one object module would speed up the process considerably.
I did never tell the telecom company this. But I used this for my own projects. I decided to put my innovative thinking to the test and started to create many C functions in one software file, often containing everything in one software file, which could be 6,000 – 10,000 lines long. This new approach saved a lot of time and made the entire process much faster. I was able to compile C code (Texas DSP C compiler) and link the object file creating a load module in just a few minutes, compared to the hours that the big company was taking.
In conclusion, my elegant use of knowledge and innovative approach to modular programming helped me to save time and increase efficiency. As Einstein said, "Everything should be made as simple as possible, but no simpler." My approach to software development was not only simpler but also faster and more efficient, making it an excellent solution for any company looking to optimize their software development process.
July–September 2004 / Consultant Project
When I joined this antenna manufacturer as a short-term consultant, their situation was clear: they had no automated testing for their embedded firmware and hardware. Antennas were being assembled, software was being revised, but quality assurance depended on manual effort. Coming directly from eight months at Nokia — where I had seen automated test systems operating on a large scale — the gap was striking.
The company gave me minimal resources: a low-cost PC, a serial line, and little else. So I went to work with what was available. Using Perl, I built a command-line driven test environment. Each test was its own process; starting the interpreter with different commands would launch a different procedure. This allowed multiple concurrent tests to run in parallel on the same machine, with several antennas connected and stacked on a movable cart.
The true innovation, however, was not concurrency but memory. Each time the system uncovered an error in the antenna firmware, I explicitly captured the condition in code. That meant every new firmware version was automatically checked against the entire history of past failures. The test system became a living archive of known errors, ensuring regressions could never creep back in silently.
The approach worked. The system found flaws. But not everyone believed the results. Younger programmers insisted that the test platform itself must be flawed. They could not disprove it, but their skepticism lingered. My contract ended before the debate could be resolved.
Six months later, the outcome was clear: the antennas shipped, and a major telecom operator in Spain discovered the very same error my Perl system had already flagged. The flaw was not in the tool. It was in the antennas.
This project remains a vivid example of how lightweight automation, even built on limited resources, can exceed expectations if it preserves memory. Most test platforms confirm today’s performance; mine also safeguarded against yesterday’s failures. In doing so, it anticipated modern continuous integration practices: never forget what has been broken, and never assume that once fixed means fixed forever.
Key Lessons:
Automated testing is not about sophistication of language or platform — it is about embedding knowledge.
Memory of past errors is as important as detection of new ones.
Resistance often comes not from technology, but from culture; skepticism of tools can mask fear of uncomfortable truths.
Vindication may come late, but the principle stands: a system that remembers will always serve better than one that merely runs.